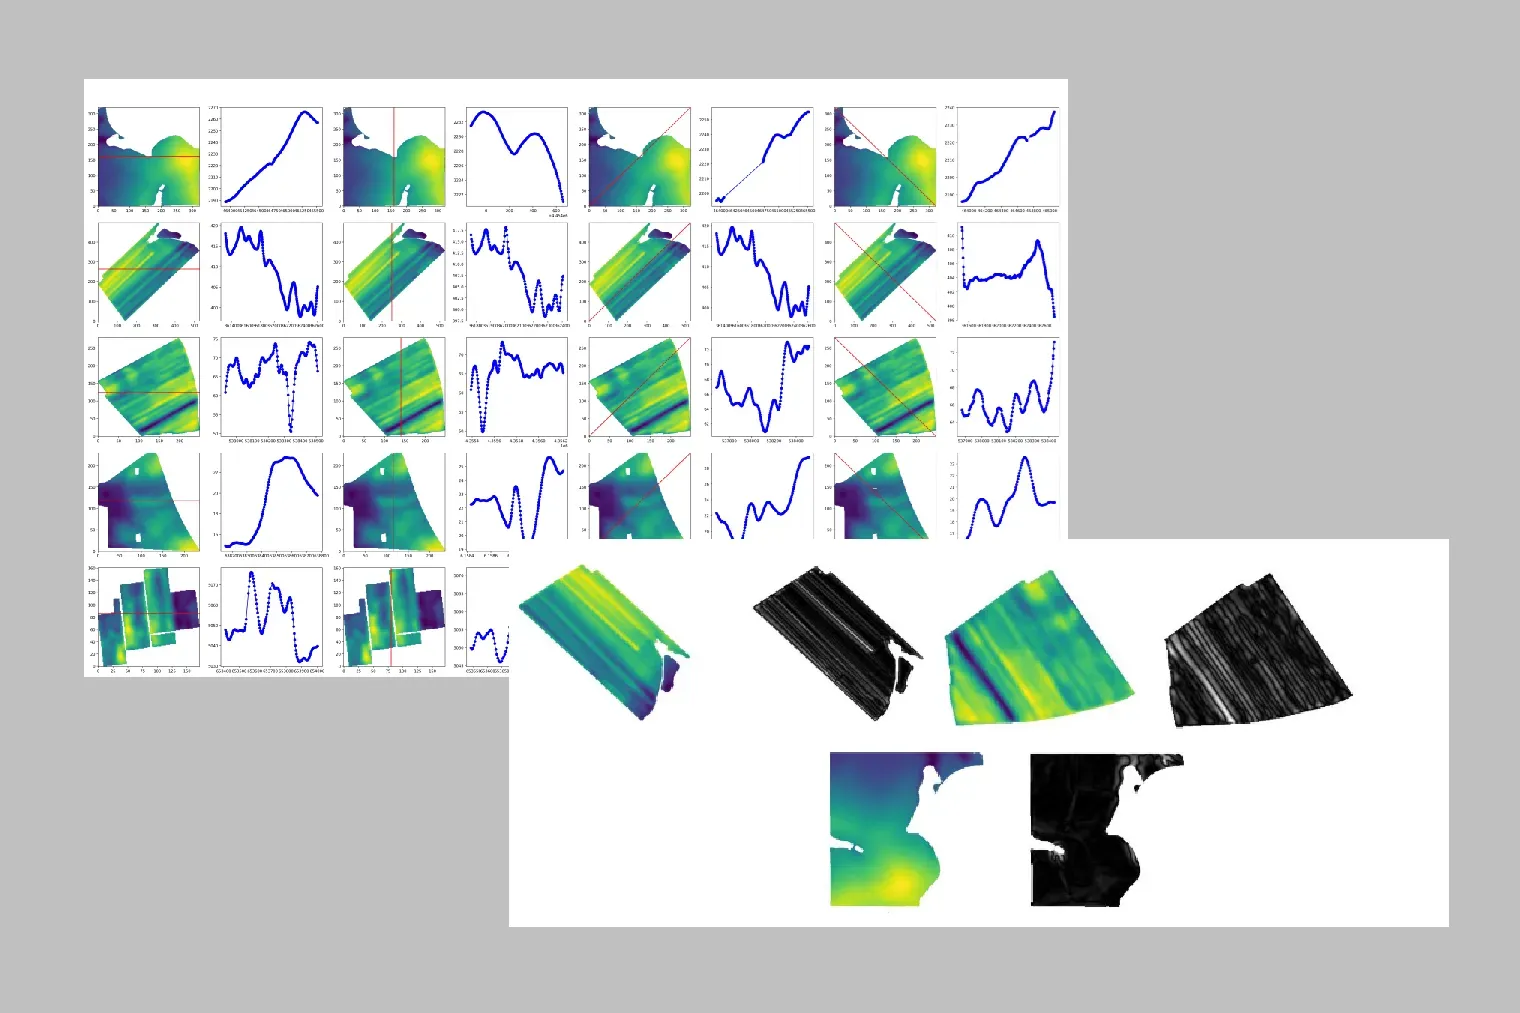
While working with the SoilOptix research team, I developed Python-based workflows to analyze high-resolution geospatial soil data and automatically detect anomalies, artefacts, and noise across large agricultural fields. Using NumPy, SciPy, GeoPandas, and Matplotlib, I implemented interpolation methods, gradient calculations, and gradient-magnitude analysis to identify sharp changes, clustering patterns, and time-lag distortions in soil property measurements. I also generated clear visualizations—heatmaps, contour plots, and gradient maps—that helped researchers quickly pinpoint irregularities and determine where micro-levelling or further correction was required. These automated scripts significantly reduced manual analysis time and improved the efficiency and accuracy of SoilOptix’s mapping process.
A major part of my contribution involved producing detailed, accessible documentation outlining the algorithms, workflows, and tools I built so they could be easily understood and reused by the team. Because the project required collaboration between software developers, geospatial analysts, soil scientists, and external research partners, I regularly communicated technical findings to professionals across different fields. I translated complex data-processing concepts into clear explanations, presented visual results to guide decision-making, and ensured that non-technical team members could interpret the insights effectively. This combination of clear documentation and cross-disciplinary communication helped streamline collaboration and strengthened the integration of my analysis into SoilOptix’s broader research pipeline.